Reading the strategy tester
Equity and drawdown, net profit, win rate, profit factor, max drawdown, Sharpe, the trade list and ambiguous fills.
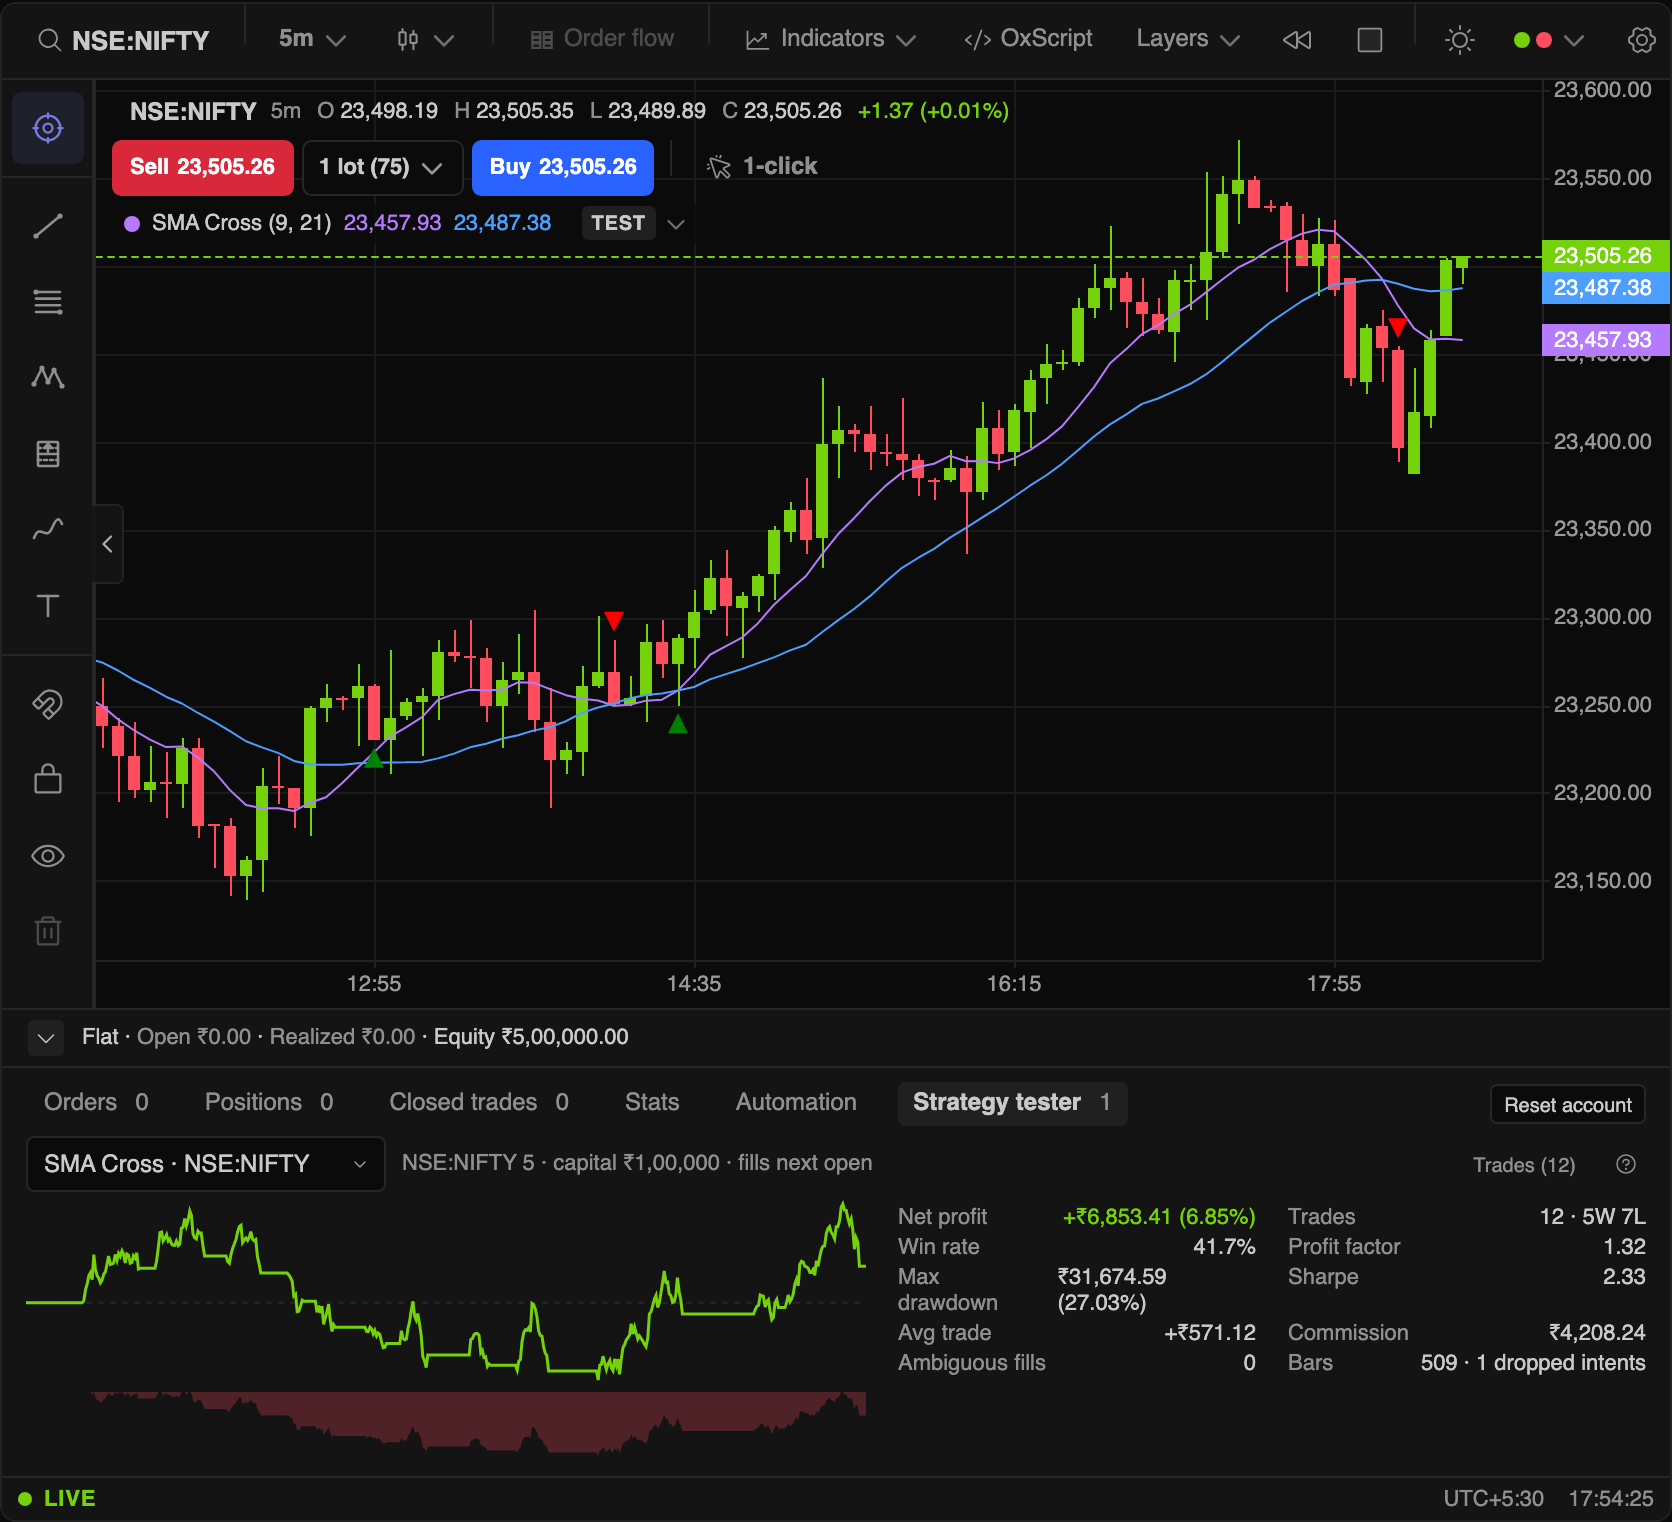
Open the trading panel's Strategy tester tab with a strategy on the chart in Test mode. The header line says what was tested: the symbol (by its readable name), interval, capital, and whether market orders fill at the next open or on the close. Trade prices print in that symbol's own decimals and quantities in its own lots.
The two curves
- Equity curve: account value bar by bar, open trades included. You want a line that climbs steadily, not one that climbs on two lucky trades.
- Drawdown (the red area below): distance from the running peak. Its deepest point is the max drawdown. Its width, how long equity stayed under water, matters as much as its depth.
The metrics
| Term | Meaning |
|---|---|
| Net profit | Sum of closed trades' P&L after commission, in money and as % of initial capital. Open trades are not included. |
| Trades | Closed trades, with wins and losses. A break-even trade counts as a loss. |
| Win rate | Wins ÷ trades. Meaningless alone: 30% can make money with big winners; 80% can lose with one big loser. |
| Profit factor | Gross profit ÷ gross loss. Above 1 makes money. 1.3–2 is typical of real edges; ∞ means no losing trade yet, which means too few trades. |
| Max drawdown | The largest fall from a peak, in money and % of that peak. Ask whether you could sit through it with real money. |
| Sharpe | Mean per-bar return ÷ its volatility, annualised, with a risk-free rate of 0. Compare strategies on the same interval only; above 1 is decent, above 3 on a backtest is suspicious. |
| Avg trade | Net profit ÷ trades. Compare it with costs: an average trade of ₹150 with ₹100 of real-world slippage is not an edge. |
| Commission | Total charged, from the header's commission settings. |
| Ambiguous fills | Bars where both TP and SL were reachable. The tester filled the stop (the pessimistic choice) because one bar can't say which came first. |
| Bars | Bars tested, and any intents that were dropped. |
Ambiguous fills in amber
A non-zero count turns amber. A few are normal. Many mean your stop and target are too close for the interval: the result is decided by the fill model, not the market. Widen them or test on a shorter interval.
The trade list
Trades (n) switches to the list, newest first: side, quantity in lots, entry and exit times and prices, P&L, R (P&L ÷ the risk to the initial stop; — without a stop), the exit reason and bars held. Scan it for one trade that makes the whole result.
Before you trust it
- Sample size. Under about 30 trades, every metric is mostly noise. Load more history or use a shorter interval before judging.
- Overfitting. If the result collapses when you move an input one step (EMA 20 → 21), you fitted the past. Good settings sit on a plateau: neighbours perform similarly.
- Out of sample. Tune on one stretch of history, then check a stretch the tuning never saw.
- Costs. Set realistic commission and slippage in the header. Index options on a 1-minute chart can lose their whole edge to costs.
- Regime. A trend strategy tested only on a trending month will disappoint in a range. Test across both.
- Next open vs close. The header shows which. Results that only work with fills on the close usually rely on a price you could not have traded.