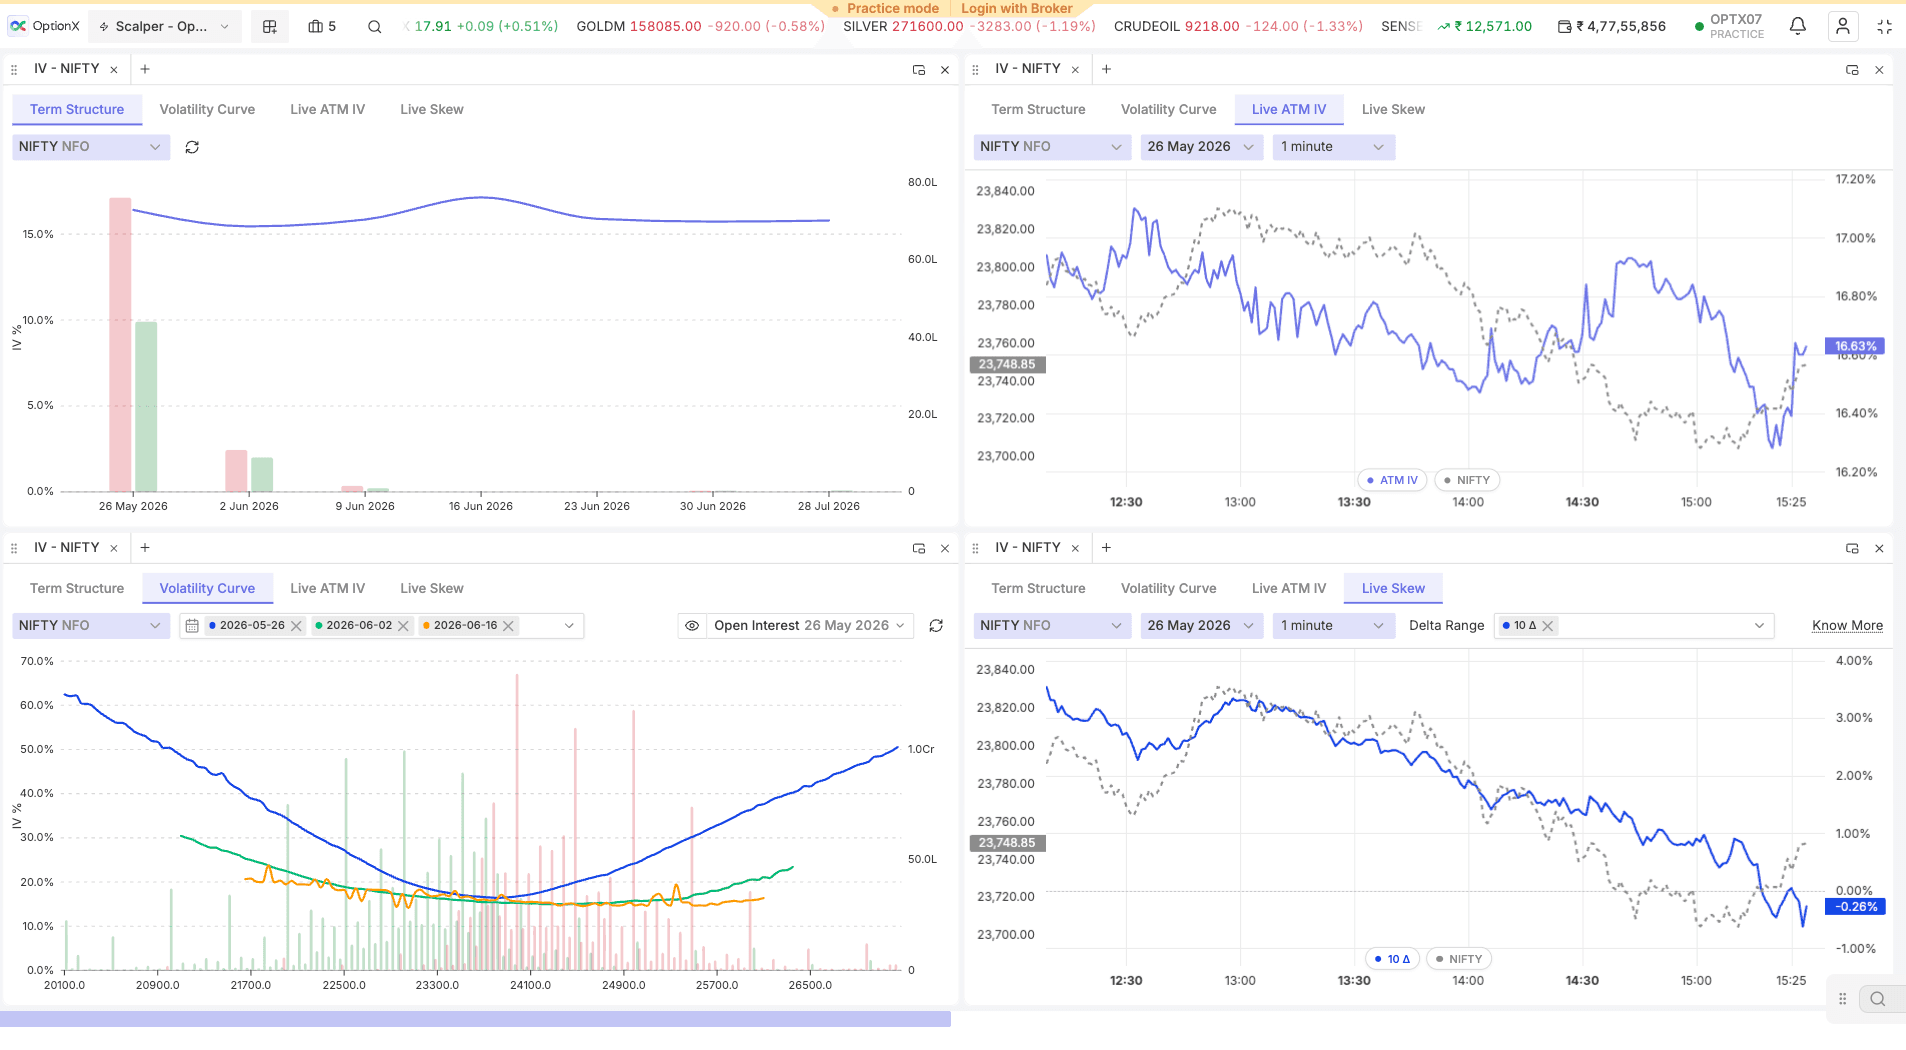
See the Full Volatility Surface — Smile, Skew, Term Structure & Live ATM IV in One Dashboard
IV Charts gives options traders a complete implied volatility analysis suite in one widget — four views, all updating live via WebSocket. Vol Curve shows how IV is distributed across strikes (the smile or skew). Live ATM IV tracks how volatility expands and contracts tick by tick during the session. Live Skew quantifies the put-call IV difference to gauge directional market fear. Term Structure plots ATM IV across expiry dates to surface calendar spread opportunities. Multi-expiry overlay lets you compare IV across weekly and monthly expiries on the same chart. Available for Nifty, BankNifty, FinNifty, Sensex, and all major NSE/BSE underlyings — the IV dashboard professional options traders actually use.
Why Elite Traders Trust OptionX
“OptionX has completely transformed my trading. The speed and precision are unmatched. I've seen a significant improvement in my P&L since switching.”
“The one-click execution and auto trailing stop-loss features are game changers. Finally a platform that understands what scalpers need.”
“The multileg trading ladder and strategy builder have made complex option strategies so much easier to execute. Highly recommended!”
Trade with Broker of your choice


Frequently Asked Questions
Implied volatility is the market's expectation of future price movement, derived from current option prices. High IV means the market expects large moves — options are expensive. Low IV means the market expects calm — options are cheap. For option sellers, high IV means more premium collected. For option buyers, low IV means lower entry cost. Trading without reading IV is trading blind on whether the price you're paying is fair.
OptionX, The Future of F&O Trading in India
- Price Ladder-Based Trading
- One-Click Order Execution
- Smart Risk Management Tools
- Ultra-Low Latency & Real-Time Data
- Paper Trading & Custom Dashboards
1bn+ Quantity Placing in 1 second
